May 2023 Jobs Recap: Labor Demand Breakdown
Labor demand continues to decline across most industries and occupations. In May we saw a drop of 1.6% in active job listings.

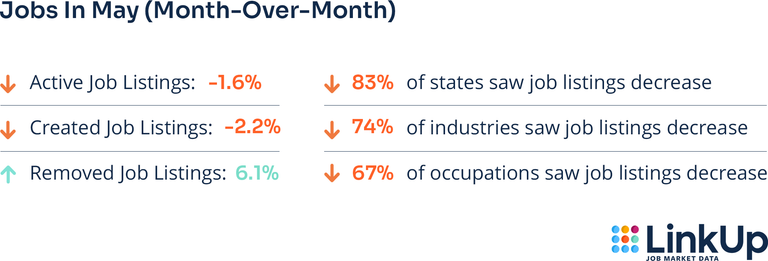
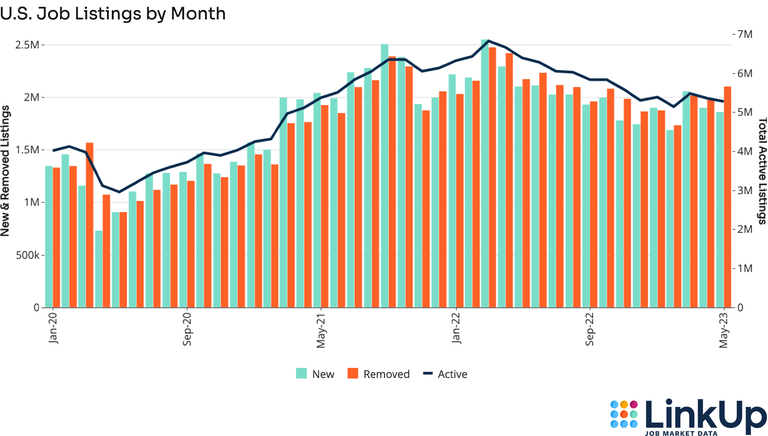
After the 2.6% decrease in active job listings in April 2023, last month in May we saw a decrease of 1.6% in active job listings indexed directly from company websites. LinkUp data shows new job listings dropped by 2.2% in May, adding to the 7.8% decline seen in April. The removed job listings increased in May by 6.1%, higher than the April level of 1.5%.
CLOSED DURATION
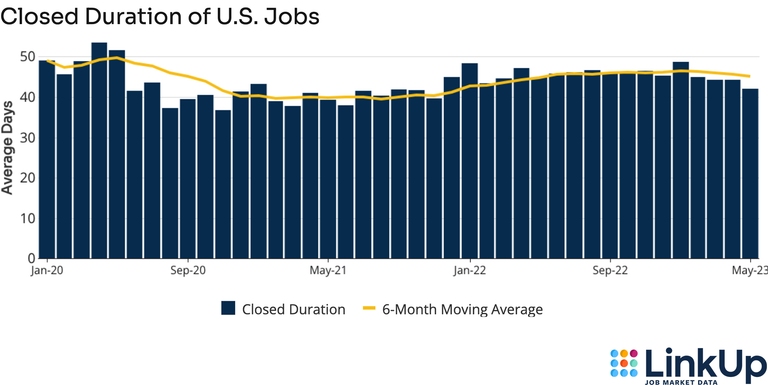
Closed duration, or the average number of days job listings are posted on company websites before they are removed, tracks hiring velocity across the entire U.S. economy. As the average number of days a job listing remains live increases, hiring velocity slows.
Last month, job listings remained open for an average of 42.0 days; 5.2% shorter than the 44.3 day average in April. This increase in hiring velocity is well below this year’s high in January which averaged 48.6 days.
JOBS DATA BY STATE
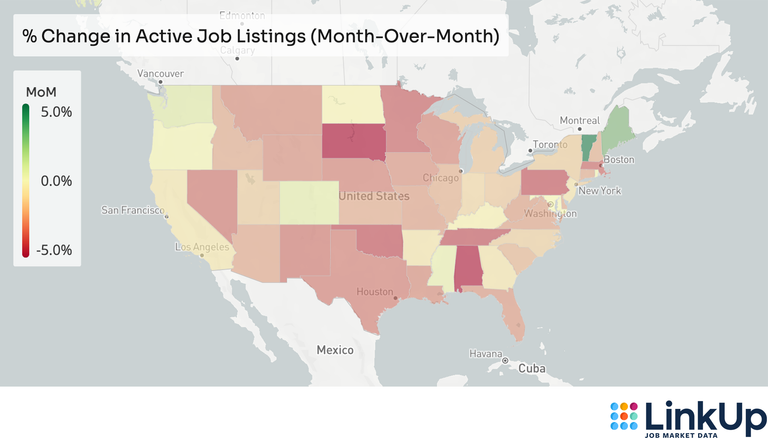
83% of the U.S. experienced declining labor demand during May. The states experiencing a slump included:
- South Dakota (-6.6%)
- Alabama (-4.7%)
- Oklahoma (-3.7%)
- Tennessee (-3.6%)
- Pennsylvania (-3.6%)
However, Vermont (4.6%), Puerto Rico (2.6%), and Maine (2.5%) had a boost in labor demand.
JOBS DATA BY INDUSTRY (NAICS)
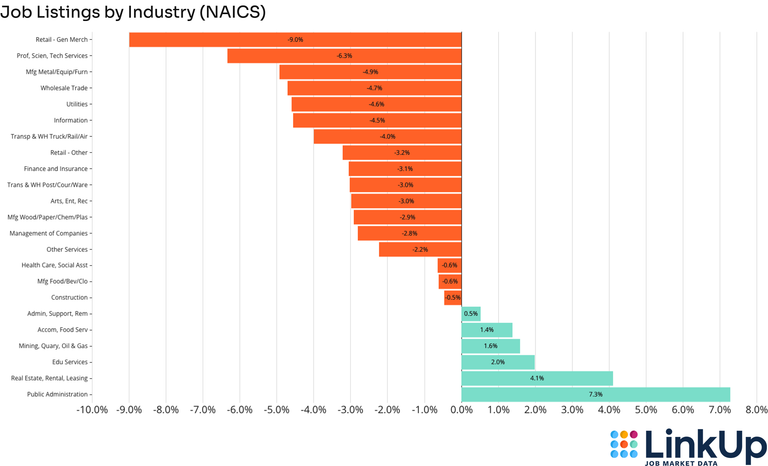
During May, 74% of industries saw a drop in labor demand. The following industries were affected the most:
- Retail Trade (Sporting Goods, General Merchandise) (-9.0%)
- Professional, Scientific and Technical Services (-6.3%)
- Manufacturing (Metal, Equipment, Furniture) (-4.9%)
Public Administration (7.3%) and Real Estate, Rental, and Leasing (4.1%) experienced the greatest increase in labor demand.
JOBS DATA BY OCCUPATION (O*NET)
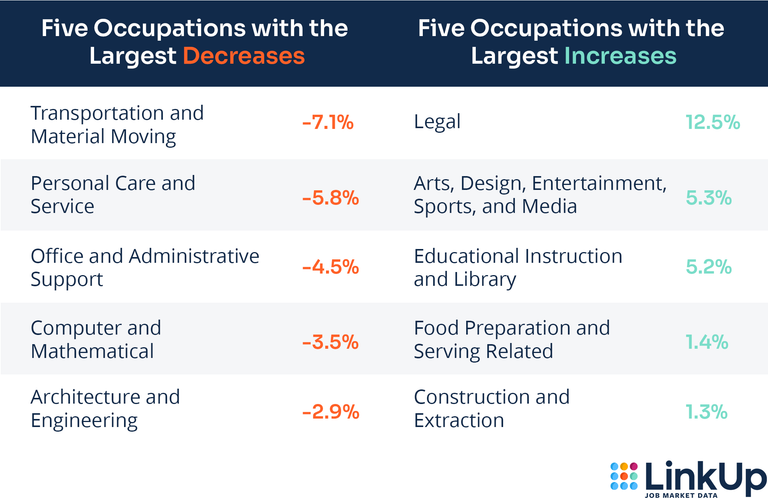
Last month, 67% of occupations experienced a downturn in labor demand. The five occupations with the largest decrease and growth include:
LINKUP 10,000
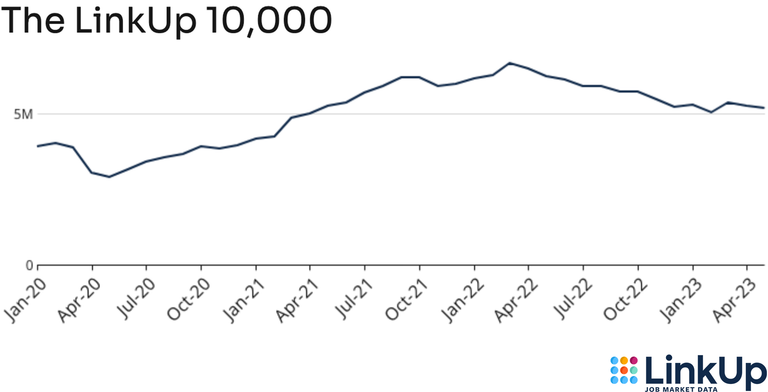
The LinkUp 10,000 is an analytic published daily and monthly that captures the total U.S. job openings from 10,000 global employers in LinkUp’s jobs dataset with the most U.S. job openings.
The LinkUp 10,000 saw a small 1.6% drop in active job listings in the U.S. labor market, in comparison to last May which saw a 4.2% drop.
S&P 500 LINKUP JOBS INDEX
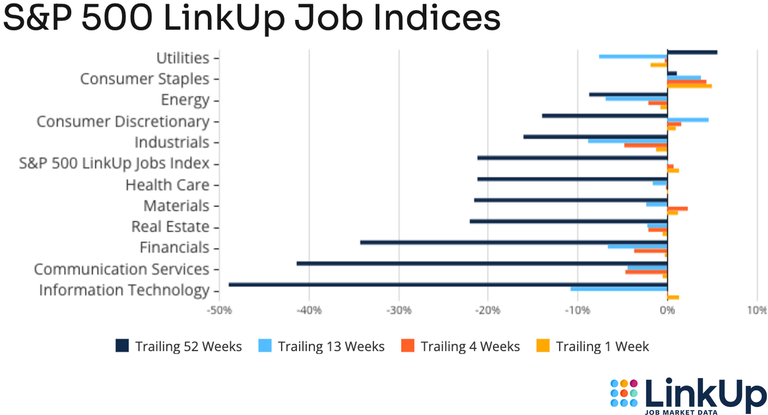
The S&P 500 LinkUp Jobs Index is designed to measure open jobs posted by the companies in the S&P 500 and is published on the S&P website. It can be viewed in aggregate or by sector.
The S&P 500 LinkUp Jobs Index shows listings were up 0.7% over the past 4 weeks overall, with an increase to:
- Consumer Staples (4.4%)
- Materials (2.4%)
- Consumer Discretionary (1.6%)
Sectors experiencing the largest drop in labor demand were:
- Industrials (-4.7%)
- Communication Services (-4.6%)
- Financials (-3.6%)
DATA DISCLAIMERS
LinkUp’s monthly data recaps incorporate revisions to previously-reported monthly data with the purpose of reporting the most accurate and up-to-date data points. For more information on what circumstances may impact data revisions, visit our Data Support Center.
Insights: Related insights and resources
-
Blog
02.18.2026
LinkUp Forecast: January 2026 JOLTS report by the BLS
Read full article -
Blog
02.09.2026
January 2026 Jobs Recap: Modest uptick in job market observed in January 2026
Read full article -
Blog
02.04.2026
LinkUp Forecasting That the U.S. Economy Lost 25,000 Jobs in January
Read full article
Stay Informed: Get monthly job market insights delivered right to your inbox.
Thank you for your message!
The LinkUp team will be in touch shortly.
