August 2025 Jobs Recap: Stalling Labor Demand
While newly created jobs increased by 3.3%, the overall labor market is dragging. Our data for August marks a continued signal of slowing growth, after this month’s BLS jobs report raised economists’ hackles about the overall health of the economy.
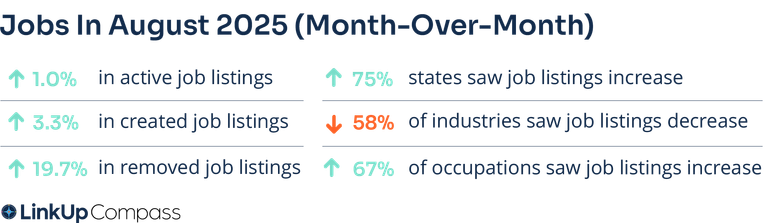
Key Takeaways:
Active job listings increased by 39,000 from July to August, signaling businesses are (very) slowly gaining momentum, but hiring remains cautious to the point of stalling.
Data from LinkUp shows an increase in time-to-fill with 53.3 days. It’s the slowest hiring velocity we’ve tracked since the COVID-19 lockdown in April 2020.
In August, Nonfarm Payrolls (NFP) in the U.S. increased by only 22,000, significantly fewer than anticipated. Unemployment is sitting at 4.3%. The economy faces uncertainty over tariffs and global conflicts that leave employers unwilling to make renewed investments in their workforce.
U.S. Job Listings by Month | August 2024 - August 2025
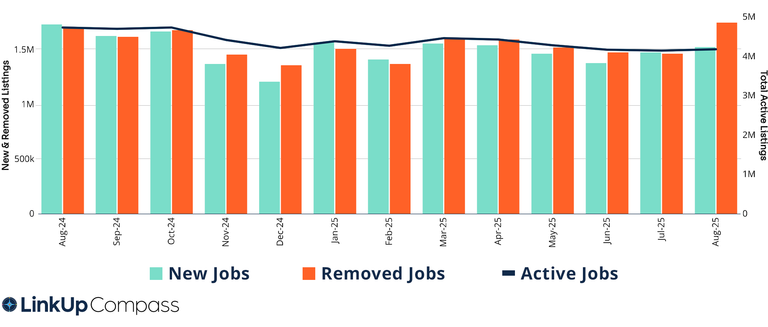
In August, LinkUp’s U.S. job data showed a modest increase in labor demand for the second consecutive month. Overall, active job listings increased 1.0% and newly created job listings increased by 3.3%. The majority of the occupations experienced growth. Keep reading as we break this down below.
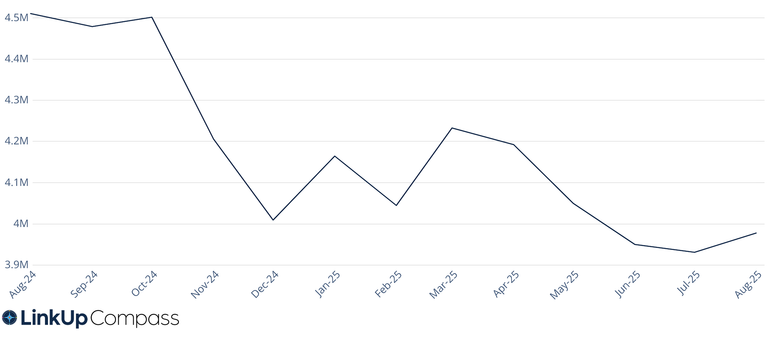
LinkUp 10,000
The LinkUp 10,000 is an analytic published daily and monthly that captures the total U.S. job openings from the 10,000 global employers in LinkUp’s jobs dataset with the most U.S. openings.
The LinkUp 10,000 increased by 1.2%, adding around 46,000 job listings. This is the first time the LinkUp 10,000 has seen any growth since March 2025. However, from a 4 month view, it is still down by 5.1%.
Monthly LinkUp 10,000 | August 2024 - August 2025
Jobs Data By Industry (NAICS)
U.S. industries are almost evenly split according to our labor market data. 58% of industries saw a drop in demand. Most notably were Public Administrations (-13.2k) and Education Services (-11.9k). The following industries were a little further behind:
Healthcare and Social Assistance (-6.8k)
Retail (-2.8k)
Manufacturing Wood. Paper, Chemical, and Plastic (-1.8k)
Industries that experienced the most growth in August were:
Accommodations and Food Services (+19.5k)
Administrative and Support and Waste Management and Remediation Services (+6.7k)
Manufacturing Metal, Equipment, and Furniture (+5.1k)
Job Listings by Industry (NAICS) | August 2025
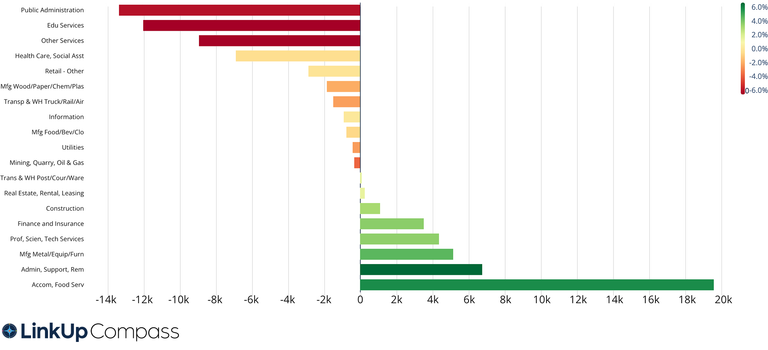
This chart displays the change in job listings across various industries, categorized by NAICS codes.
Jobs Data By Occupation (O*NET)
67% of U.S. occupations experienced growth in August. Food Preparation and Serving related occupations saw the highest growth with an addition of 12.0k job listings added. The occupation with the largest drop in demand was Healthcare Practitioner and Technical roles with a 3.9k decline.
Other occupations that saw a rise in demand:
Transportation and Material Moving (+7.5k)
Protective Service (+5.0k)
Office and Administrative Support (+4.5k)
Job Listings by Occupation (O*NET) | August 2025
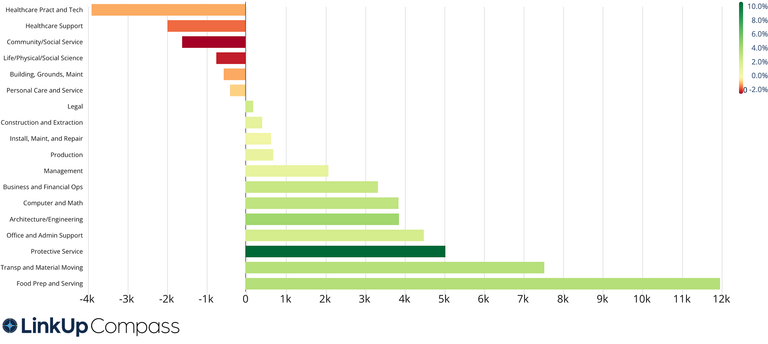
This chart displays the change in job listings across various occupations, categorized by O*NET codes.
Closed Duration
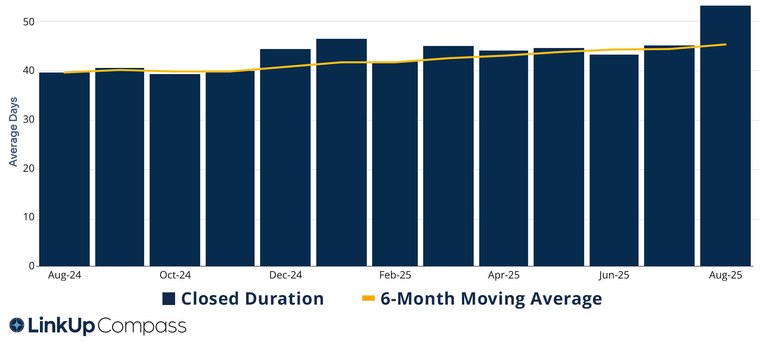
Closed duration, or the average number of days job listings remain live on company websites before removal, tracks hiring velocity across the U.S. economy. As the average duration increases, hiring velocity slows.
During August, the average time it took for a job to close was 53.3 days. Hiring velocity has continued to climb since August of last year when it was 39.6 days.
Overall, the time to fill a position hasn’t been this slow since 2020 when COVID-19 lockdown started. Most companies are saying this is because of current economic conditions.
Time to Fill By Month | August 2024 - August 2025
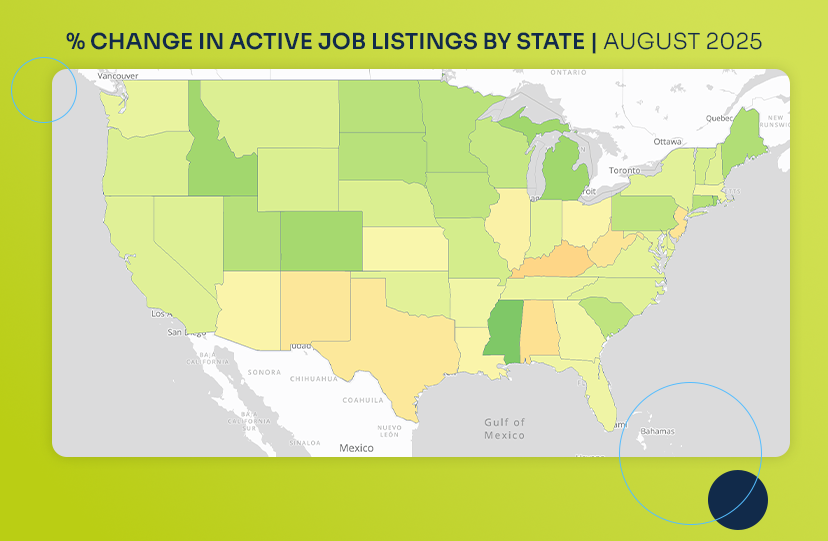
Jobs Data By State
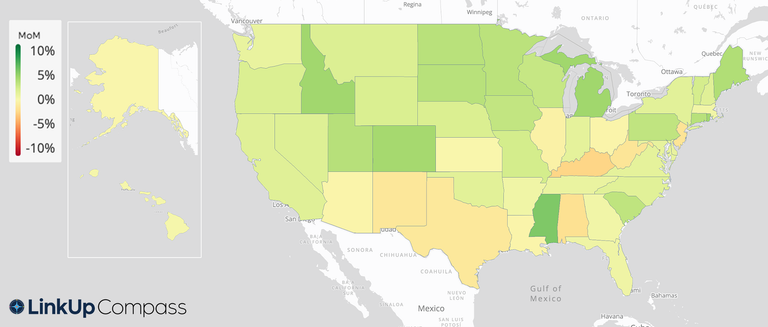
75% of the United States experienced an increase in active job listings, but Mississippi led with a 5.2% increase. After Mississippi, the states and territories that saw the most growth in listings included:
Missouri (+4.1%)
Idaho (+4.1%)
Rhode Island (+4.0%)
Colorado (+3.9%)
We also see that Washington D.C. is continuing to cut back on active job listings. LinkUp data shows a 5.1% decline.
Percent Change in Active Job Listings by State (Month-Over-Month) | August 2025
DATA DISCLAIMERS
LinkUp’s monthly data recaps incorporate revisions to previously-reported monthly data with the purpose of reporting the most accurate and up-to-date data points. For more information on what circumstances may impact data revisions, visit our Data Support Center.
Insights: Related insights and resources
-
Blog
08.22.2025
July 2025 Jobs Recap: Despite more jobs, the hiring process is moving at tortoise pace.
Read full article -
Blog
08.13.2025
LinkUp Forecast: July JOLTS report by the BLS
Read full article -
Blog
08.07.2025
Q2 2025 Economic Indicator Report
Read full article
Subscribe to our Newsletter: Get monthly U.S. labor market insights delivered right to your inbox.
Thank you for your message!
The LinkUp team will be in touch shortly.
